
Grafana is the open-source standard for observability - build dashboards and explore metrics, logs and traces across any data source.
Developer Tools
Screenshots
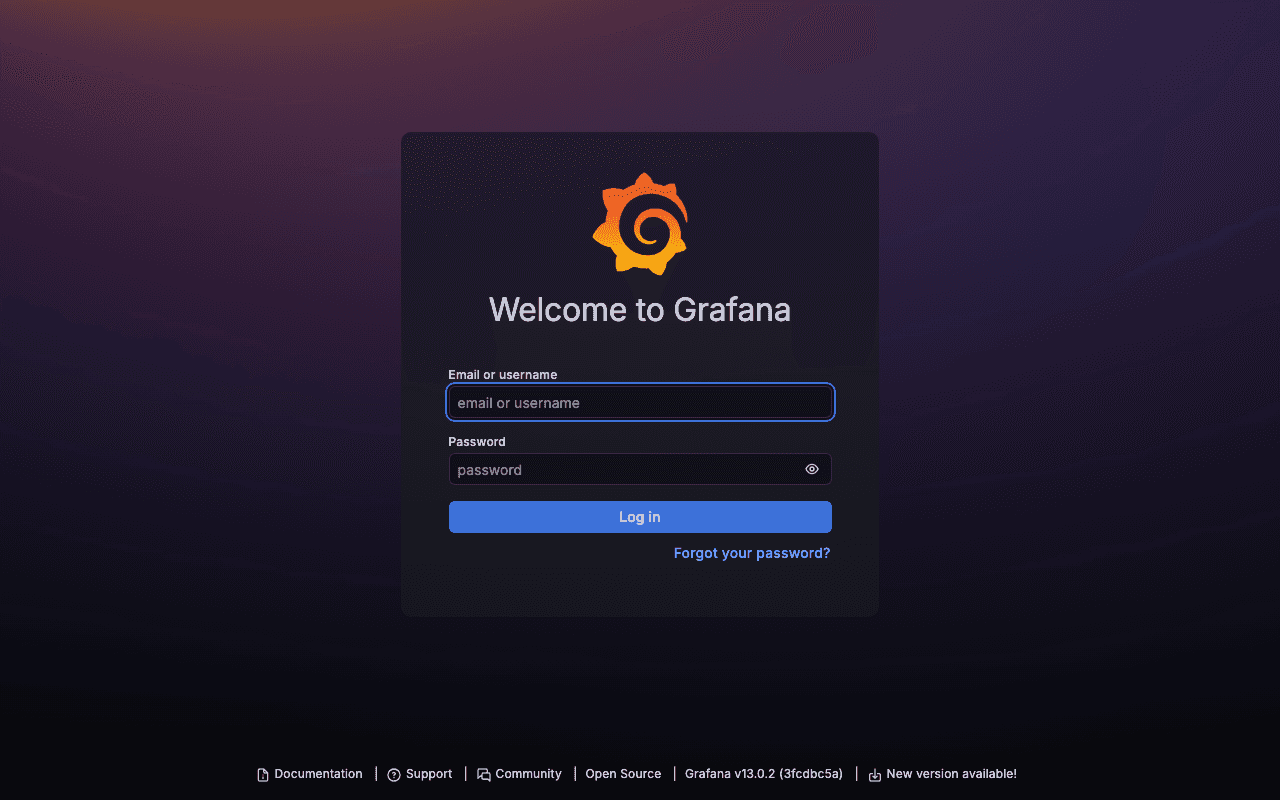
Grafana
Grafana is the open-source standard for observability - build dashboards, explore metrics, logs and traces, and set up alerts across any data source you connect.
Getting started
- Open your CApp URL and log in with your account username and the password you set at checkout.
- Add a data source under Connections -> Data sources (Prometheus, InfluxDB, PostgreSQL, and dozens more are supported out of the box).
- Build a dashboard under Dashboards -> New, or import one of the thousands of ready-made community dashboards by ID.