
Vaultwarden
Developer Tools
Vaultwarden is a lightweight, self-hosted password manager compatible with the Bitwarden apps and browser extensions.

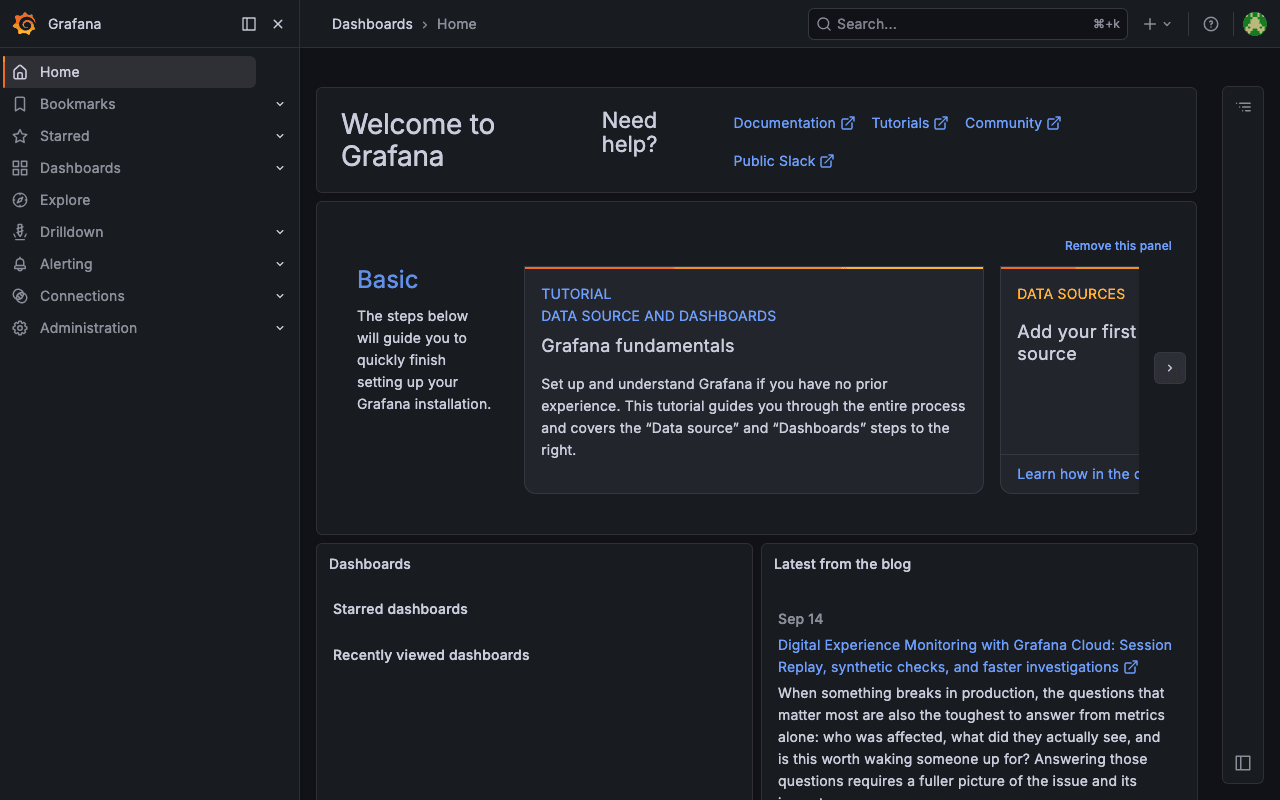
Grafana is the open-source standard for observability - build dashboards and explore metrics, logs and traces across any data source.
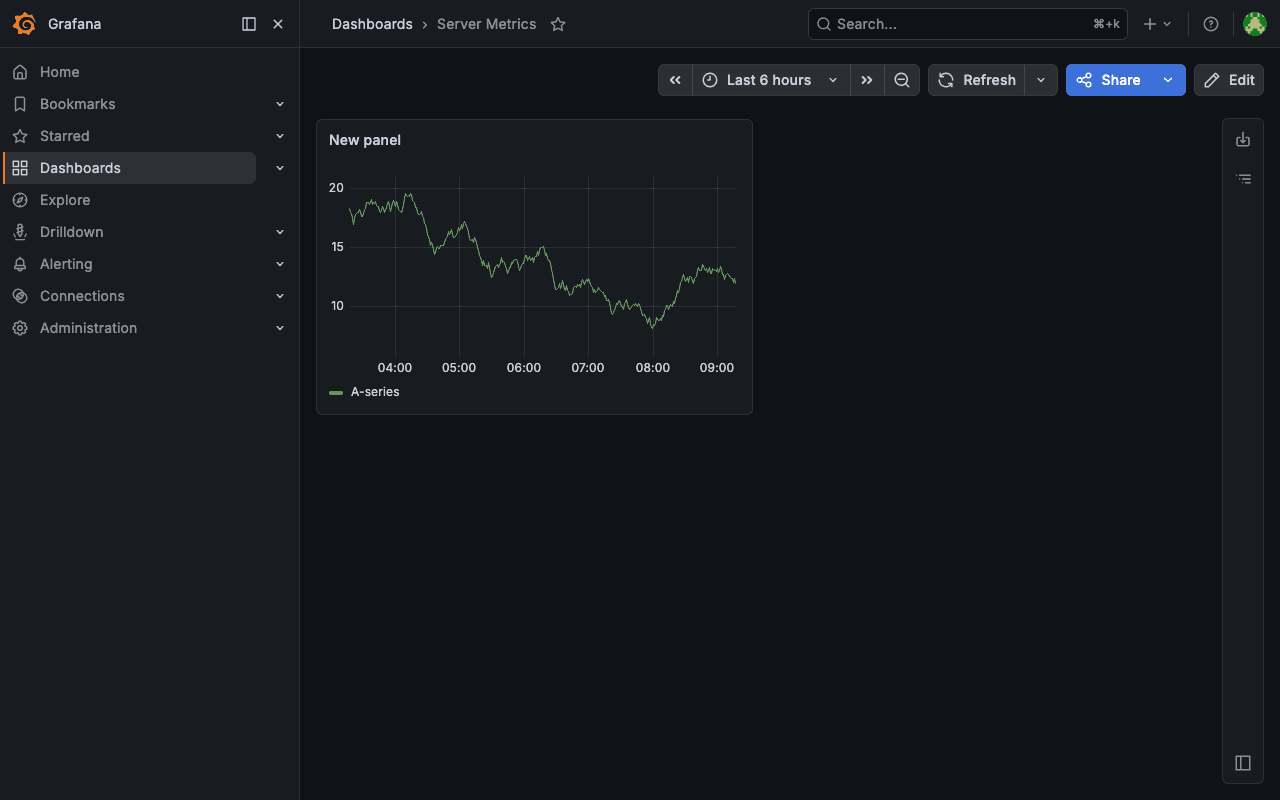
Grafana is the open-source standard for observability - build dashboards, explore metrics, logs and traces, and set up alerts across any data source you connect.
Yes, in "My CApps". Cancel before the free trial ends and you pay nothing.
Yes. Download it as an archive at any time and restore a backup whenever you like.
In a GDPR-compliant EU data centre, isolated in its own container.
Yes. Adjust CPU, RAM and storage in "My CApps"; the price change is prorated.
Vaultwarden is a lightweight, self-hosted password manager compatible with the Bitwarden apps and browser extensions.

Uptime Kuma is a self-hosted uptime monitor with a live status page and instant notifications.

Gitea is a lightweight, self-hosted Git service for repositories, issues and pull requests - a fast alternative to GitHub.

Forgejo is a lightweight, self-hosted Git service for repositories, issues and pull requests - a community fork of Gitea.

PocketBase is an open-source backend in a single file - realtime database, auth, and file storage.

Metabase is an open-source business intelligence tool for building charts, dashboards, and exploring your data without SQL.